
Latest product news from Float
Float Product Updates
Improvement
Feature update
Linked budgets update - scenarios

Shared by Graeme
• August 29, 2024
Model increases in incomes or costs in just a few clicks
Linked budgets are now available with scenarios, meaning a scenario increase can be calculated using the budgets from the Base scenario.
How does this work?
When creating a linked budget on a scenario, budgets from the Base scenario can be used as a source.

In the above example, Baseline sales is on the Base scenario and can be used to calculate a 10% increase in sales on the scenario. No more having to manually calculate and update each individual amount.
If you have any feedback about these changes, or changes you’d like to see, please don’t hesitate to contact us.
Feature update
Improvement
Payroll: setting the date
Shared by Graeme
• August 21, 2024
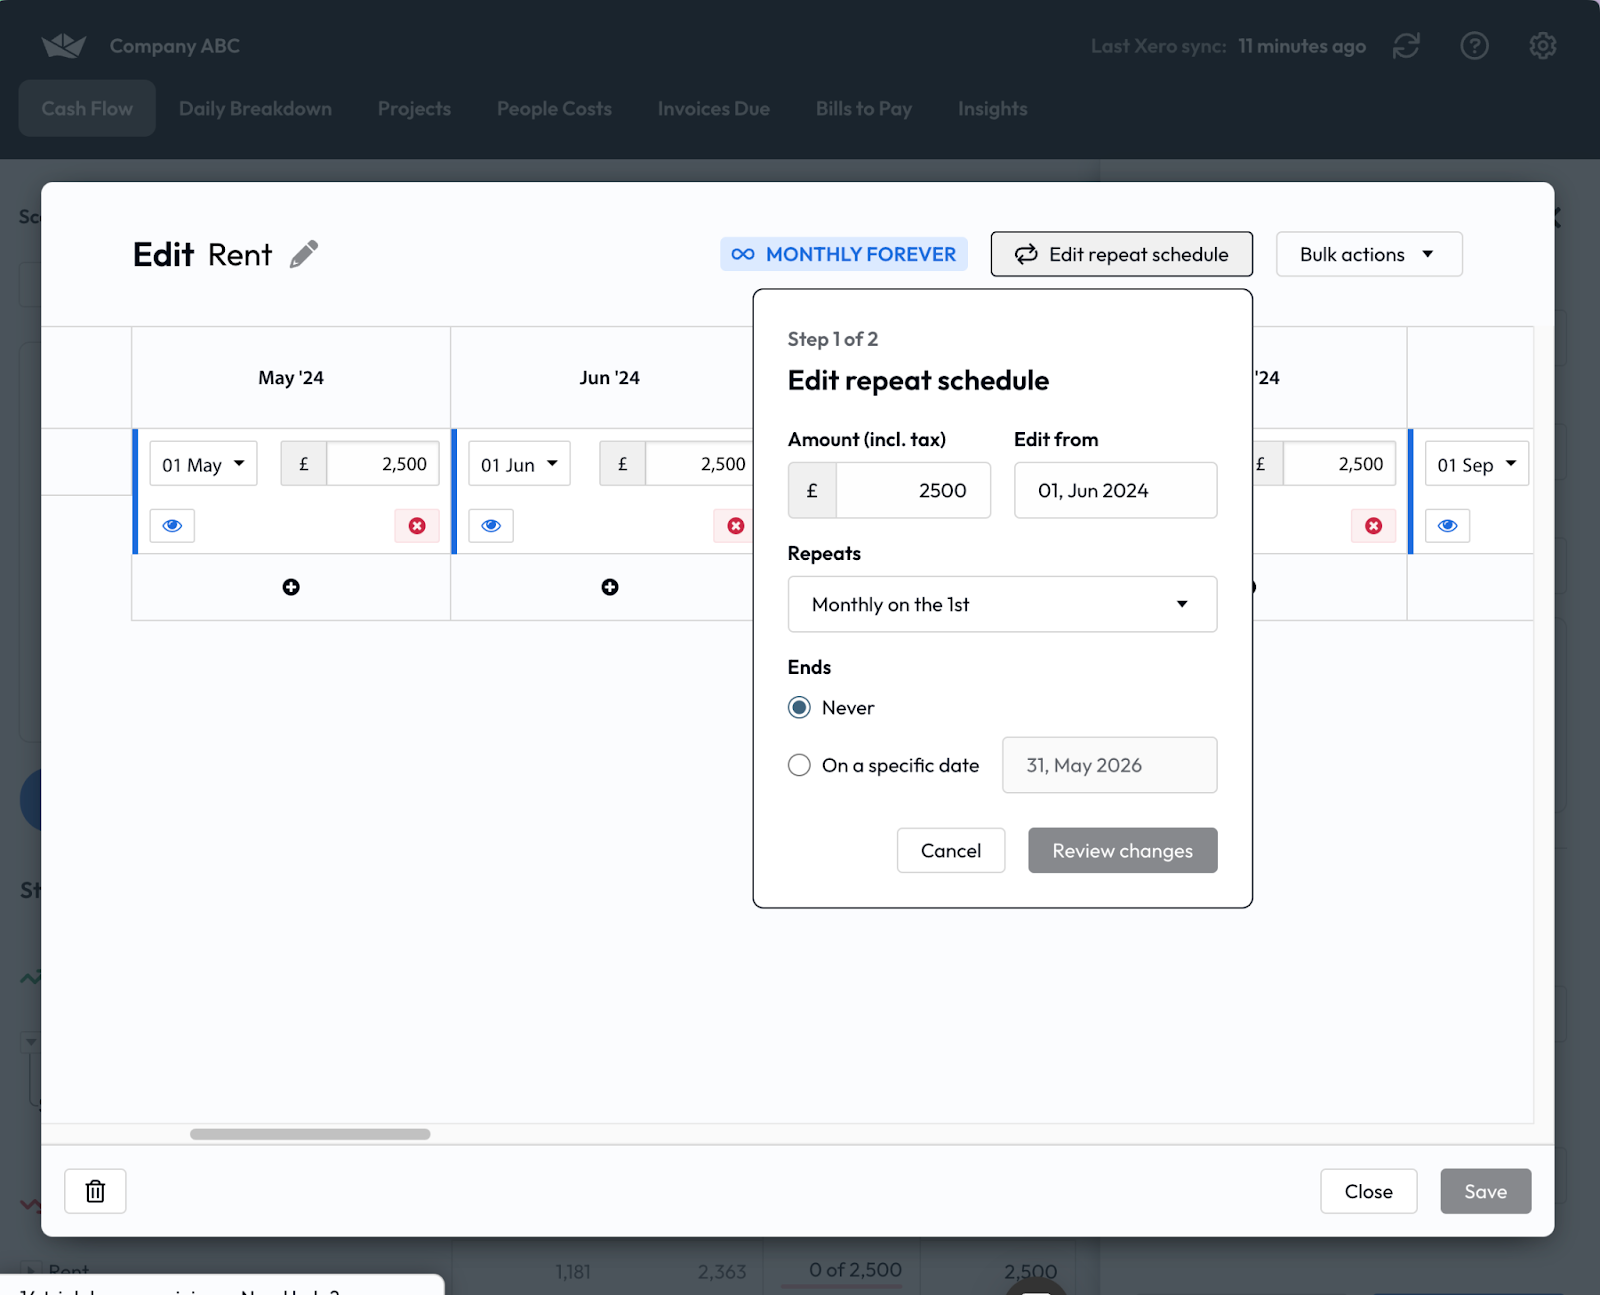
Auto payroll defaults to impacting the cash flow on the 31st or last day of the month.
This date can now be updated to be any day within the month.

Product update
Improvement
New feature
Linked budget update - date offset
Shared by Graeme
• August 01, 2024
We are announcing 2 updates to linked budgets.
- Date offset
- Improved previews
Date offset
We know not all incomes and costs occur at the same time. When creating a linked budget you can choose to offset it from the source budget.
This is useful in situations where a cost may be incurred before a sale happens, e.g. buying stock in advance, or where a cost occurs after a sale happens, e.g. commission paid 60 days after the sale.
If you have existing linked budgets you would like to update, click them to edit and the offset option will be available.

Improved previews
When creating a linked budget, the preview now shows the first 3 months' values, giving you a sense check that these figures match up with expectations.
When creating a linked budget the graph preview will display the expected balance, so you can understand the impact of the new budget before saving it to the cash flow (this also works for other types of budgets).


Improvement
Daily View: dates remembered between sessions

Shared by Alastair
• July 18, 2024
Minor improvement to the Daily View: if you set a date, it will remain the same between sessions on the same browser.
New feature
Product update
Linked budgets
Shared by Graeme
• July 17, 2024
We’re excited to announce Linked Budgets, a major – and highly requested – update to the Float product.
Linked budgets
Linked budgets allow you to model incomes or costs based on other figures in the cash flow.
Creating a linked budget allows you to use another income/cost, or a collection of incomes and costs, as a source. The linked budget is set as a percentage of the source and will occur on the same date and repeating schedule in the cash flow.

Automatic updating
When you change one of the source incomes/costs, the linked budgets will automatically update and stay in sync.
For example, if COGS is 10% of Sales, creating a linked budget means that whenever the Sales figure is changed the COGS cost will automatically update to reflect 10% of the new Sales figure.
Quick changes
If a cost changes from 10% to 20%, quickly update the linked budget and all future values will update. No need to individually change each future value.
This also allows for potential changes to be modelled without having to create a whole new scenario.
To start with, linked budgets will be available on the ‘Base’ scenario in the cash flow. Also, linked budgets can't be used as the source for other linked budgets.

Feature update
Improvement
Product update
Increasing & decreasing incomes and costs
Shared by Alastair
• June 11, 2024
We’re delighted to relaunch increasing/decreasing income and costs with an exciting change: they’ll now calculate in perpetuity, ensuring every time you come back to Float there will be less work to do.

Here’s how it behaves:
- Increasing amounts continue to be calculated until the budget end date (if there is one) or in perpetuity if ‘never’ is selected
- Decreasing budgets will eventually hit zero and when that happens, it will continue to show ‘0’ until edited
- You can set a monetary amount, or a percentage.
New increasing and decreasing incomes & costs are not backwards compatible with the older style. We’re recommending customers recreate budgets if they want to take advantage of these time-saving changes.
If you have any questions or product feedback, please send us a message.
New feature
Product update
Continuous budgets
Shared by Graeme
• May 06, 2024
Continuous budgets solve the problem of budgets not updating if they’re set beyond the end of cash flow.
Now, when you return to Float and a new month has rolled around, budgets that were set into the future will automatically be updated. For example, if the end of the cash flow is in 6 months, and you create a monthly cost that runs for 12 months, when month 7 rolls into view, the value will automatically be there.
It reduces the amount of work you need to do to keep your cash flow updated. The schedule can be updated within the budget itself.
Any new budgets will automatically behave continuously unless a specific end date is added.
Update existing incomes & costs to behave this way by clicking on the budget and updating using the controls. Check out our help guide for more information.
New feature
Feature update
Product update
Graph preview and streamlined income/cost creation
Shared by Graeme
• May 06, 2024
|
We’re excited to announce updates to the core Float experience:
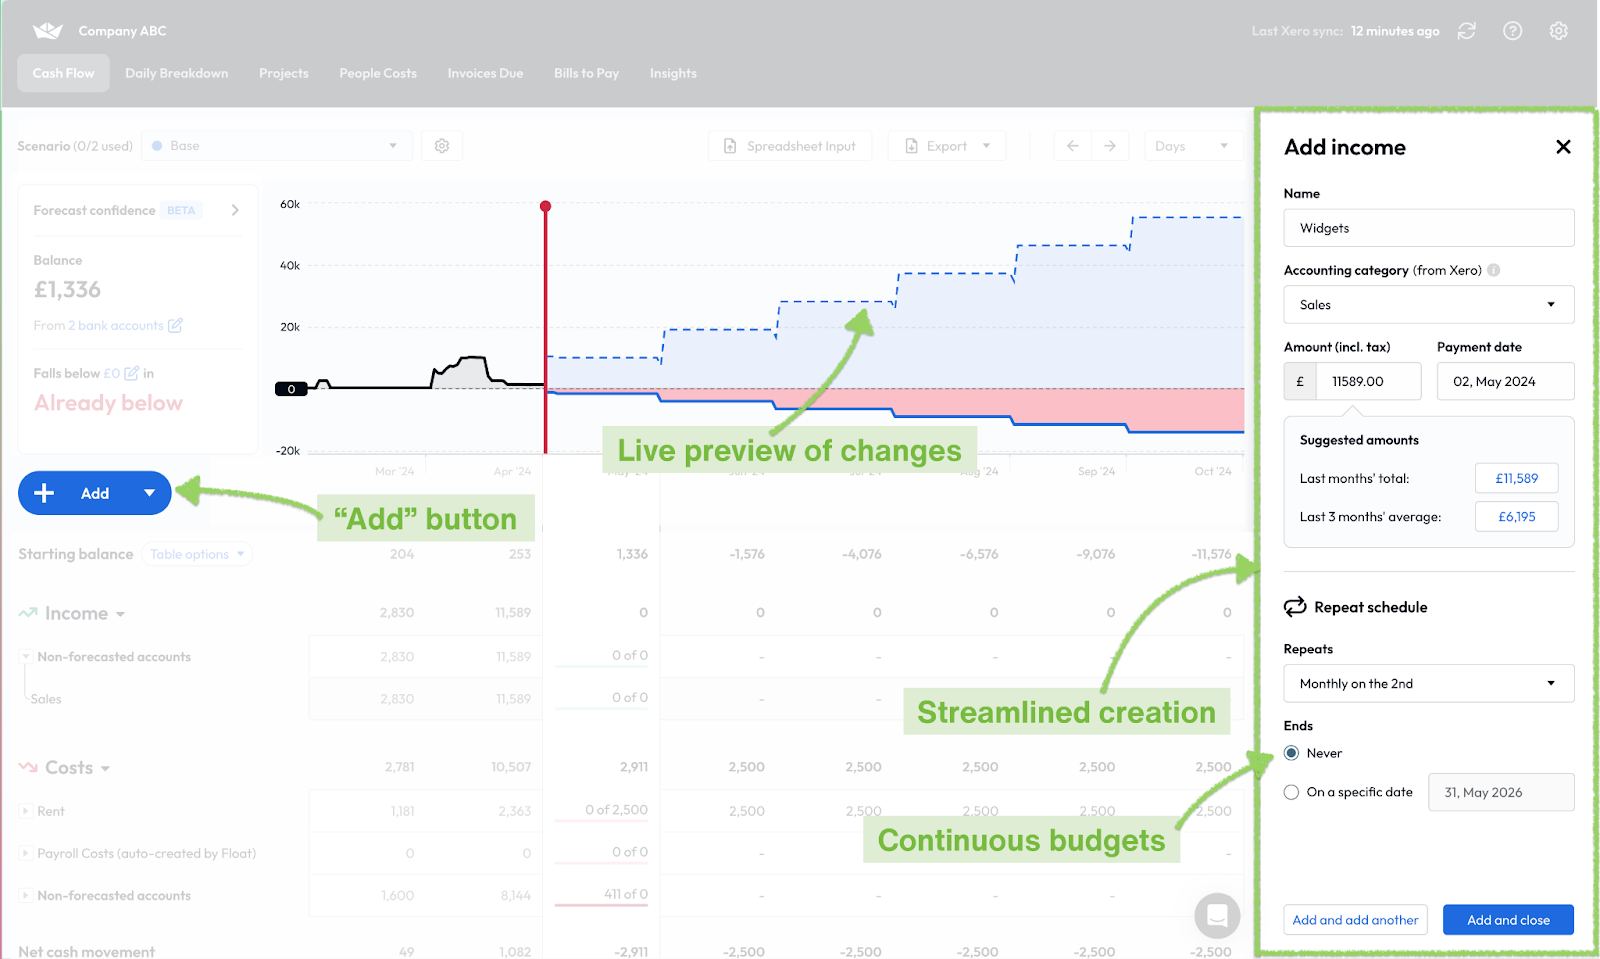 Streamlined income and cost creation When creating a new income and cost, that’s now streamlined into a panel so the context of your cash flow and graph are visible at the same time. Adding multiple incomes and costs is now easier with an ‘Add & add another’ button. In addition, there’s an ‘+ Add’ button on the cash flow, giving direct access to the creation of New Hires, Projects, Incomes, and Costs. The original buttons are also still in place: 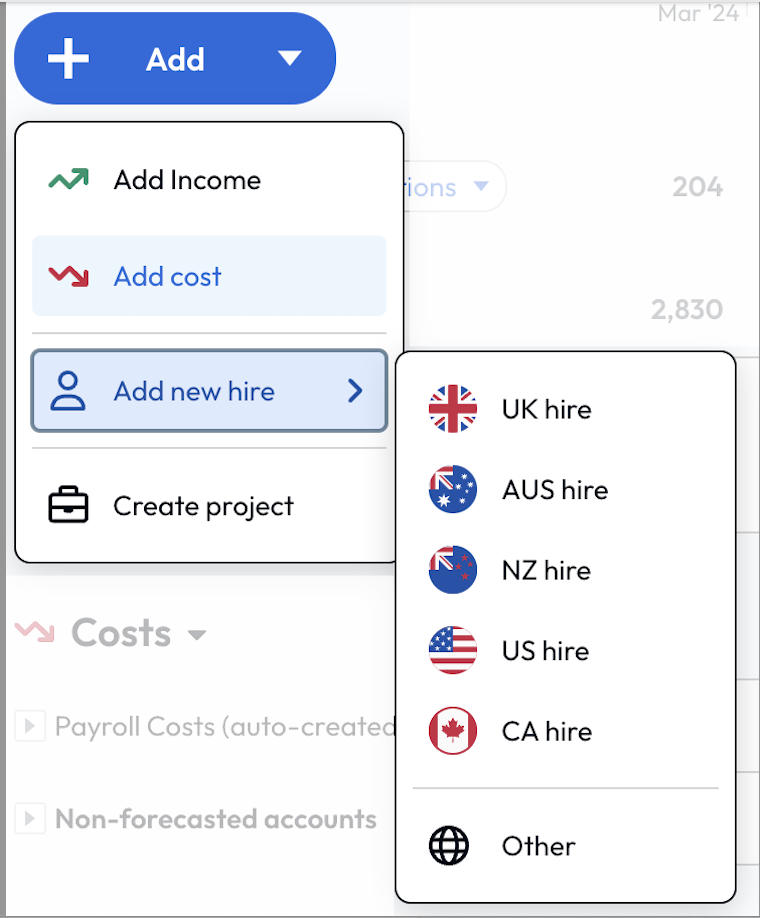 Live graph preview When adding an income or cost, there’s now a preview of the impact of making that change, giving you an instant sense of how the change affects your cash flow. 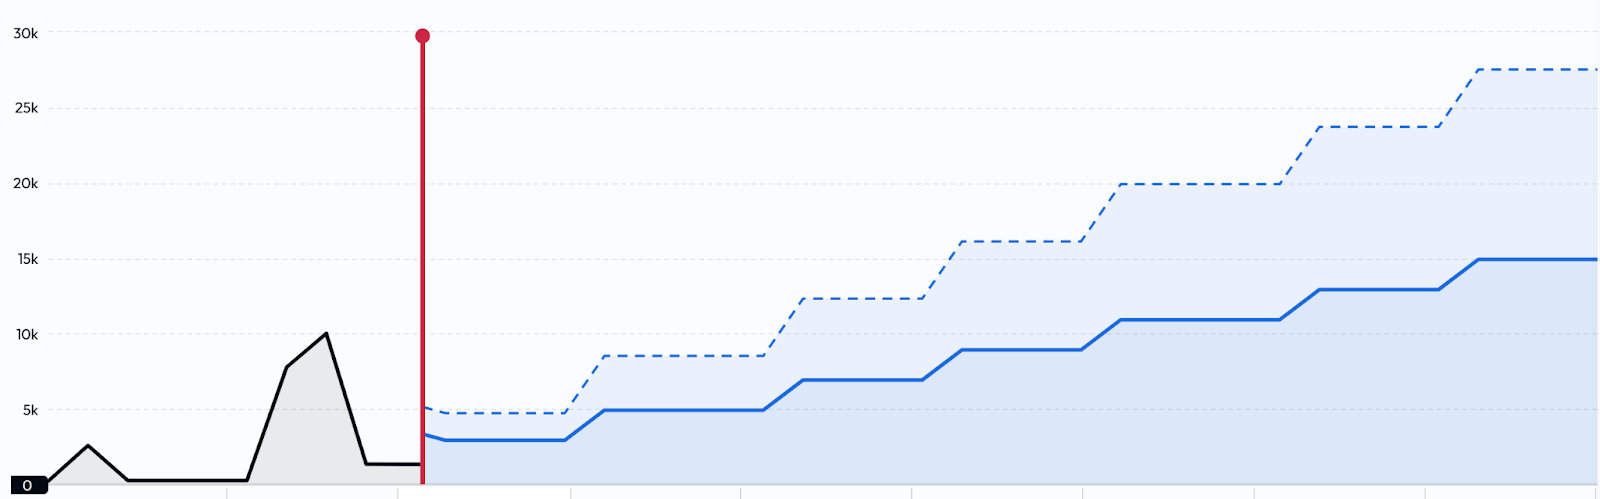 |

Feature
New feature
Product update
Forecast confidence beta
Shared by Alastair
• November 14, 2023
Float's excited to announce our new Forecast confidence module, which shows in realtime the health of your cash flow in a simple and easy to understand way. No more wondering "how confident can I be in my cash flow?"

Float's goal is to empower you to make confident financial decisions, so every time you log in, it should be obvious what decisions you can take.
We'd love your feedback to help refine the module, so please send all feedback our way.
Feature update
Improvement
Cash flow graph updates
Shared by Graeme
• July 18, 2023
We've released a few changes around the main cash flow graph.
1. Months in the graph aligned with the month columns
Easily scan the table with the month on the graph displayed above the relevant column in the table.

2. Threshold value displayed on the graph
Easily see when you drop below your threshold. The graph will shade red when dropping below the threshold value. The example below shows a threshold of 5,000.

3. Bank balance and threshold relocated
See more of your cash flow with these tiles being set alongside the graph. The unreconciled amount is also merged into the bank balance tile. For example, the unreconciled amount is shown in the below example as ± £4,135.04.
